Relative Strength Index
The Relative Strength Index, or RSI indicator, is a momentum indicator which compares the level of past gains and losses in order to determine if a currency or any other asset has been overbought or oversold. It moves within a defined range of 0 to 100. When the RSI is higher than 70, the asset is considered overbought and price is expected to move down. When it is lower than 30 the asset is considered oversold and price is expected to move up.
Relative Strength Index is calculated using this formula:
| RSI = 100 – | 100 |
| 1 + RS |
RS is the Average Gain in the relevant periods / Average Loss in the relevant periods
The RSI is set by default to 14 periods. We recommend using at least 250 data candles prior to the start date of the chart being used in the calculation, because Values are more accurate with longer periods.
How to Trade with the RSI Indicator
The main goal of the Relative Strength Index is to identify oversold or overbought assets. An asset is overbought when RSI is above 70, and oversold when it is below 30.
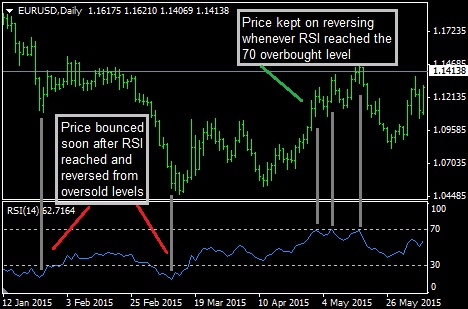
The following chart illustrates the use of RSI. Its levels appear in the bottom of the chart. In this case the calculation was performed on 14 periods. In this example, the RSI accurately predicted price reversals both on an overbought and oversold market conditions.
Combining RSI with Support/Resistance Indicators
It is important to understand, however, that the process of price topping out in overbought conditions or bottoming out in oversold conditions isn’t necessarily immediate and can be an extended process. Performing a trade immediately when price enters the overbought or oversold areas can be a mistake, as the price may still not have topped or bottomed out. It is always a good idea to look at the price chart to see if the price has reached a resistance level when the indicator is overbought, or if price has reached a support level when the indicator is oversold.
Overbought-oversold reversal trade signals for the RSI work best when the market is in consolidation. At such times, the highs and lows of price action are at horizontal levels which are clearly defined. The signals will also work around pivot points.

81% of retail investor accounts lose money when trading CFDs with this provider. You should consider whether you can afford to take the high risk of losing your money.